 Do you need an overview of which Outlook Store apps are being used in your Exchange organization or Office 365 tenant?
Unfortunately, there is no direct way to report this but with a PowerShell one-liner and the Excel PivotTable and PivotChart feature, you can quickly create a nice looking report with an interactive table and chart.
- Exchange PowerShell One-Liner
- Excel PivotTable and PivotChart
- PowerShell Command: Export-AppReportOutlook
Exchange PowerShell One-Liner
 The Exchange PowerShell One-Liner that is needed to create a csv-export of all the apps that your users are using is;
Get-Mailbox -ResultSize Unlimited | ForEach-Object {Get-App -Mailbox $_.identity | Select-Object -Property DisplayName, Enabled, AppVersion | Export-Csv applist-export.csv -NoTypeInformation -Append}
After running this command, you’ll find the export in your Home folder. By default;C:\Users\%username%\applist-export.csv
Note:
You can of course specify another location after the Export-Csv command or use the PowerShell Command version below to get prompted for a location or specify it as a variable.
Excel PivotTable and PivotChart
 To make a bit more sense out of the results logged in the csv-file, we’ll open it in Excel and use the PivotTable and PivotChart feature to create a useful interactive table and graph out of it.
- Open the csv-file in Excel.
- If your data isn’t automatically being converted into Excel columns;
- Select the A column or press CTRL+A.
- Switch to the Data tab.
- Click on: Text to Columns.
- Select: Delimited.
- Press Next.
- Select: Comma.
- Press Finish.
- Select the Insert tab.
- Click the down arrow on the PivotChart button and choose: PivotChart & PivotTable.
- In the dialog that opens, click OK.
- In the PivotChart Fields panel on the right:
- Select DisplayName.
- Drag & drop the Enabled field into the Values area.
- Drag & drop the Enabled field into the Filters area.
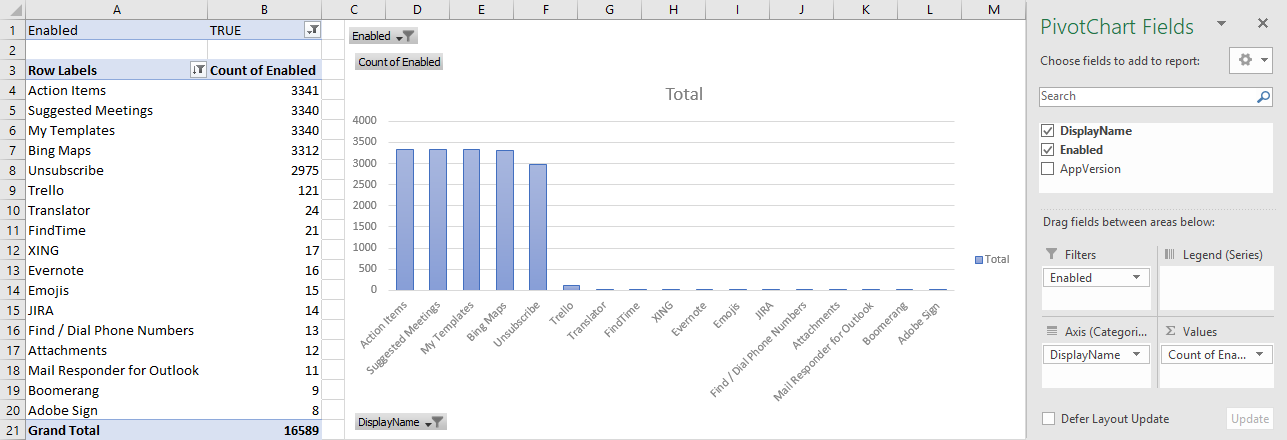
You will now see a table with all the unique names of the Office Store add-ins that are being used and how often they are installed.

PivotTable and PivotChart with Fields configuration for reporting Outlook Store Apps usage.
Tips!
- At the top, you can use the Enabled dropdown list to quickly see how many of them are enabled or disabled. The table and graph will update automatically.
- To sort the apps by how often they are installed, enabled or disabled, click the down arrow on the “Row Labels” cell (A3) and choose: More Sort Options…. You can now select: Descending (Z to A) by: Count of Enabled.
PowerShell Command: Export-AppReportOutlook
 If you want to create these exports on a regular basis, then it might be more convenient to turn this into custom PowerShell cmdlet.
To do this, place the code below in your PowerShell Profile (create the file if it doesn’t exist yet) while PowerShell is closed. The default location is;
C:\Users\%username%\Documents\WindowsPowerShell\Microsoft.PowerShell_profile.ps1
You can then use the Export-AppReportOutlook command and specify the location of your csv-file.
- Example
Export-AppReportOutlook C:\Users\Robert\Documents\applist-export.csv
Function Export-AppReportOutlook
{
	[CmdletBinding()]
	Param
	(
        	[Parameter(Mandatory=$true, Position=1)]
        	[string] $FileName
	)

	Get-Mailbox -ResultSize Unlimited | ForEach-Object {Get-App -Mailbox $_.identity | Select-Object -Property DisplayName, Enabled, AppVersion | Export-Csv $FileName -NoTypeInformation -Append}
}

